Blogs

Global investments in clean energy in 2015

Bloomberg New Energy Finance reports that 2015 was a record year for global investment in clean energy, with $329 billion.  The previous record was $318 billion in 2011.  China contributed $110.5 billion, followed by US at $56 billion.  India invested $10.9 billion.  For details see https://www.washingtonpost.com/news/energy-environment/wp/2016/01/14/why...

This is despite low fossil fuel prices around the world.  This goes to show that the cost of clean energy (wind and solar) is reaching a tipping point--renewable energy is achieving parity with new fossil fuel generation.

Half of new generating capacity globally was from wind and solar.  As of end of 2015 wind and solar provide about 5% of electricity to the US grid.


Impact of wind energy on water savings--helping states hit with severe drought

LBNL and NREL report (http://eetd.lbl.gov/node/60652) quantifies the impact of wind deployments due to renewable portfolio standards (RPS).  These renewable energy projects have reduced the amount of water withdrawn and consumed by conventional power plants.  Look at California and Texas two states with severe droughts; both states are benefiting from wind power.


Water savings, billions gallons

Impact of wind energy on reduction of air pollution due to particulate matter

I found this interesting chart in http://www.aweablog.org/national-lab-report-wind-energy-win-win-win-for-...

It quantifies the health and economic savings from reduced air pollution in all regions of the country--it is a conservative estimate of the cost of air pollution and only focuses on savings from renewable energy’s reduction of one air pollutant: particulate matter.


Health costs due to air pollution

Benefits of Renewable portfolio standards (RPS)

Lawrence Berkeley National Labs (LBNL) and NREL are reporting (http://eetd.lbl.gov/node/60652):

  1. Under the RPS standards in 2013, 98 TWh of electricity (2.4% of total US generation) was generated from renewable energy sources
  2. This resulted in 7.5 c/kWh of benefits in terms of GHG and air pollution  emissions reductions
    1. 2.2 c/kWh from GHG, 59 million metrics tons of GHG
    2. 5.2 c/kWh from air pollution emissions reductions--77,000 metric tons (mt) of SO2, 43,900 mt of Nitrogen Oxides, 4,800 mt of particulate matter 2.5
  3. In addition, water use consumption is reduced by 27 billion gallons, and withdrawal reduced by 850 billion gallons
  4. $20 billion in GDP from 200,000 jobs
  5. Reduced consumer electricity prices by 0 to 1.2 c/kWh
  6. Reduced demand for natural gas (as fuel for electricity generation) leading to reduction in cost by 1.3c to 3.7c /kWh of RE

RPS standards exist in 29 states and Washington, DC.

The above estimates show that the savings from RE has huge: 8.8 c/kWh to 12.4 c/kWh.  This ignores savings in water consumption and benefits of higher GDP.

On the costs side, there is 2.3 c/kWh for 10 years of production tax credit from the federal government, and RPS costs.  Regarding the latter costs "RPS compliance costs over the 2010–2013 period were generally equivalent to less than 2% of average statewide retail electricity rates, but varied substantially, with the net cost to utilities and other loadserving entities ranging from -0.4 to 4.8¢ per kilowatt-hour of renewable electricity (kWh-RE)" (see http://eetd.lbl.gov/sites/all/files/lbnl-1003961.pdf, page 14).  Although these are estimates that will be refined over time, the benefits are overwhelming.

LBNL-NREL report


Wind power progress in US since 2008

Compelling stats according to AWEA (as of end of 2015):

• More than quadruple total capacity since 2008 with more than 70 GW now installed

• Cut costs 66 percent in six years

• Set records for share of the electricity mix across entire states and regions

• Create 73,000 well-paying U.S. jobs

• Reduce carbon pollution and save millions of gallons of water as compared to other energy sources

• Save money for consumers, companies and cities, while also help them achieving their sustainability goals

Cost of Wind and Solar Energy in US is falling below fossil-fuel based generation

As pointed out in previous blogs, the power purchase agreement (PPA) for wind in 2013 and 2014 were close to 2.5 cents per kWh for 20 years.  Can buyers get cheaper electricity for such long term?  Wind farm owners do get another 2.3 cents for 10 years in the form of production tax credits (PTC) from the federal government.

Now lets consider solar, for details see this article:

Austin Energy signed agreement to buy solar for less than 4 cents per kWh.  Other deals have been signed for lower price.

A similar trend is occuring outside the US, in June 2015 UAE signed an agreement to buy 200 MWp of solar power for 5.84 US cents per kWh.

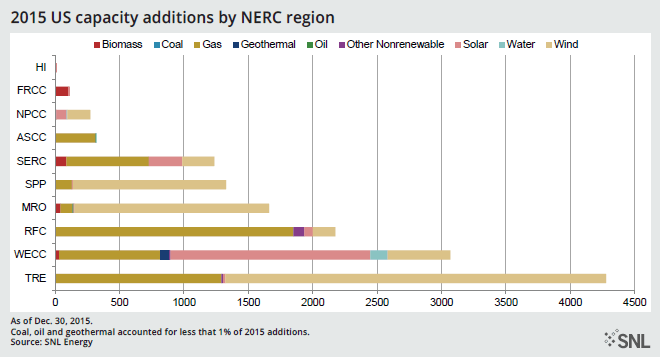
So, forget regulations and government mandates, economics is driving growth in wind and solar.  As mentioned in a blog before, in 2015 wind, gas and solar were the top three sources of new generation (total of 96%), and coal and oil came in at less than 1%.


Wind is the largest source of new generation (again) in US

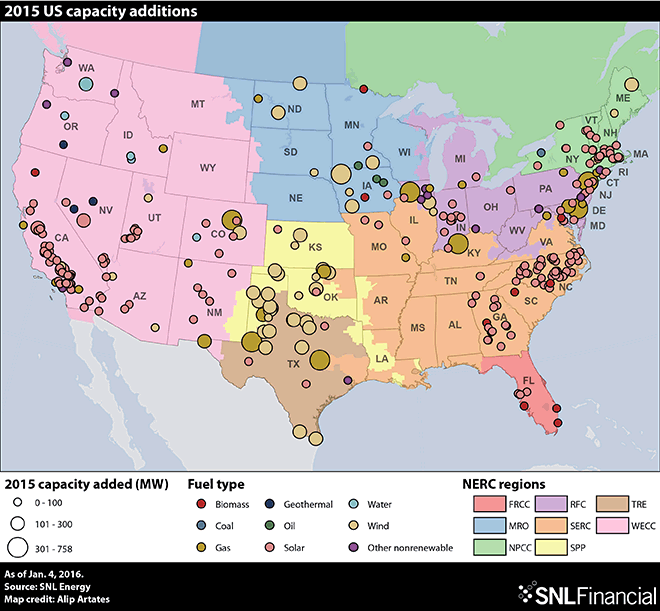
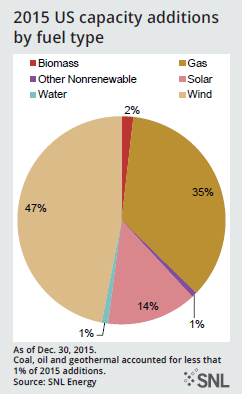
In 2015, wind provided 47% of new generation capacity.  Gas came in at 35%, followed by solar at 14%, while coal, oil and geothermal accounted for less than 1%.  Total new generation capacity was 14,468 MW.  For more information, see https://www.snl.com/InteractiveX/Article.aspx?cdid=A-34950800-13103. 

All this is happening despite loud skepticism about climate change and clean energy.  This is pure economics, the cost of wind and solar generations have dropped below the cost of new coal generation.

See the details in these charts from SNL Energy.

New generation in US


Pie chart of new generation by source


Global GHG emissions and impact of RE in reducing emissions

Currently the global GHG emissions are about 50 giga tons of CO2 equivalent (GtCO2eq).  

With business as usual scenario, this will rise to 110 GtCO2eq by 2050.

With the pledges made at COP21 in December 2015 in Paris, the emissions will stay flat at around 50 GtCO2eq until 2050 and then start declining after 2050.

Source: http://www.irena.org/rethinking/IRENA%20_REthinking_Energy_2nd_report_2015.pdf 

New concept to raise hub height

Suzlon is using a hybrid tower for its 2.1 MW wind turbine.  Its base is a lattice tower and above it sits the normal cylindrical (or conical) tower, for a total height of 120m.  See http://www.suzlon.com/images/Enerasia.png.  I have not found the exact dimensions of the lattice tower, but it looks to be about 40m in height.

At a high level, this is an inexpensive way to increase hub height and gain higher production.  The claim I have seen here is that there is a 4 to 5% increase in wind speed, which amounts to 12 to 15% increase in annual energy production (AEP).  Even if this claim is exaggerated, an increase of 10% AEP is a big deal with a modest amount of investment.


Update: Shooting for 170m hub height.   For more details see "Wind Turbine Towers Poised To Reach ‘Mega’ Heights."